

The key metrics are cash flow, return on investment, profit margin, and break-even point. Cash flow shows actual money available for operations and growth. Return on investment measures gains relative to cost and helps rank options. Profit margin reveals how much revenue stays after expenses and signals pricing or cost issues. Break-even point identifies the sales level needed to avoid losses and frames risk. Other useful figures include revenue growth rate, debt ratio, and working capital turnover for short-term health. These indicators together give a clear view of viability, scalability, and risk. The next sections explain how to calculate and apply each metric in real cases.
Key Takeaways
- Go beyond headline revenue and dive into profitability. By looking at gross, operating, and net margins, and how they trend, you reveal where value is created or lost and can guide pricing and cost initiatives.
- Cash flow metrics, particularly operating cash flow and free cash flow, have priority as you want to verify the business generates cash for reinvestment, dividends, or debt service.
- Evaluate capital efficiency and stability using return on assets, return on equity, asset turnover, debt-to-equity ratio, current ratio, and interest coverage to benchmark performance and identify leverage or liquidity risks.
- Combine growth indicators such as historical and projected revenue, customer acquisition and retention metrics, and the PEG or LTV to CAC ratios to assess whether growth is sustainable and economically viable.
- Conduct sensitivity analysis and scenario planning to stress-test your assumptions, surface the highest-impact variables, and prepare for both best-case and worst-case contingency plans.
- Integrate metrics into dashboards, tables, and a pre-deal checklist to help ensure transparent and repeatable decisions and keep evaluations aligned with strategic goals.
Beyond Surface-Level Metrics

Beyond top-line revenue and profit, more nuanced indicators give you a sense of how a business really operates and where value lurks. These metrics mix financial and operational signals: cash flow timing, capital use, customer behaviors, and risk measures. They indicate true sustainability, assist in establishing realistic goals, and highlight process solutions such as inventory days or support ticket resolution times.
1. Profitability Potential
Gross, operating, and net margins indicate where revenue is retained and where expenses sting. Contrast margins with industry medians to identify true competitive strengths. A high gross margin combined with a weak operating margin, for example, indicates a problematic cost structure. A few years of trend analysis expose consistency or one-time spikes, and EBITDA margin removes non-cash and financing items to uncover underlying operations. Think of ROI on certain products or lines. Gross profit margin alone can obscure low returns after marketing or onboarding costs, such as long time-to-productivity that defers revenue capture.
2. Cash Flow Reality
Operating cash flow verifies if core work converts into cash, not accruals. Free cash flow indicates space for reinvestment or debt paydown remaining after capital spend. Monitor month-to-month swings for seasonal liquidity gaps and accounts receivable days to identify collection slippage. Stable, positive cash flow is a buy signal. Volatile cash with good reported earnings warrants due diligence on accounting timing and data quality and on the instruments used to measure cash positions.
3. Capital Efficiency
ROA and ROE measure return on the capital base and on shareholder equity, respectively, both helping determine whether assets are productive. Beyond surface-level metrics, asset turnover provides sales per unit of asset and highlights under-utilized plant or software. Benchmarking against peers often uncovers simple fixes, such as better allocation, lease versus buy choices, or tighter inventory management to lower inventory days and free working capital. Small shifts in allocation can significantly increase returns.
4. Risk Profile
Debt-to-equity and current ratio show leverage and short-term solvency. Interest coverage indicates whether debt service is secure under stress. Look at earnings and cash flow volatility to establish stress cases. External risks, such as market shifts, new regulations, or a more powerful competitor, alter acceptable leverage and the emphasis placed on growth compared to stability.
5. Growth Trajectory
Look at historical and projected revenue growth and whether growth is organic or acquisition-driven. Let’s use PEG to translate price into growth expectations. Go beyond surface-level growth metrics and track how many customers you’re acquiring and retaining, because increasing churn eats away at surface growth. Pair these with activity metrics such as adoption for critical tools to dig deeper to understand whether momentum will hold.
The Profitability Deep Dive

A profitability deep dive is an intense survey of a company’s finances to discover where the profits originate and where they are seeping out. It should be routine: monthly checks of standardized reports and margin trends, and quarterly reviews that benchmark efficiency and track progress toward annual goals. Seasonal swings have to be considered, and farm-related ratio illustrations demonstrate how niche statistics fit into general practice.
Gross Margin
Gross margin shows revenue left after direct costs. Compute it as revenue minus COGS divided by revenue and follow it monthly to detect early signals of price pressure or supplier cost shifts. Contrast against industry averages. Retail, manufacturing, or agricultural benchmarks vary significantly, so employ sector-specific information when you evaluate competitiveness. A declining gross margin month over month many times signals it is time to renegotiate supplier terms, pricing, or product mix. For instance, a food manufacturer dealing with elevated ingredient costs could increase prices on high-margin SKUs and simultaneously push efficiency on core SKUs to defend margin. Use gross margin to test pricing scenarios: small price increases, changed pack sizes, or supplier swaps, and model their effect on margin and volume.
Operating Margin
Operating margin measures profit after operating expenses, which is calculated by dividing Operating Income by Revenue. Watch for changes to identify if SG&A or overhead are outpacing sales. Track this metric quarterly to tie process changes or headcount moves to results. Compare against competitors to determine if your cost structure is lean or bloated. An otherwise healthy gross margin can be devoured by lax operating control. Let operating margin insights help you direct cost cuts or process improvement projects. Automation, outsourcing, or tighter turns on inventory often increase operating margin without harming revenue. Periodic efficiency reviews and mapping initiatives to margin outcomes keep the improvement efforts aligned to financial goals.
Net Margin
Net margin is the final check: Net Income divided by Revenue, reflecting taxes, interest, and one-time items. Watch it over time for steady bottom-line performance and peer comparison. Dissect drivers: tax strategy, financing costs, or unusual charges can sway results. Isolate recurring operating performance from noise. For farming, incorporate ratios such as net farm income and return on assets to obtain complete context. Don’t use net margin analysis to decide your capital structure, dividend policy, or long-term investment.
Decoding Cash Flow Statements

A cash flow statement tracks real cash and cash equivalents flowing through a company over a specific time period, such as a month, quarter, or year. Cash flows are classified into three broad categories: operating, investing, and financing. They may be prepared using either the direct method or indirect method. Grasping these parts is key to identifying liquidity dangers, financing ability, and whether a company can pay operating costs, service debt, and make investments when necessary.
Operating Cash Flow
Operating cash flow is cash generated by core business activities. Compute it from net income, adjusted for non-cash items and working capital changes with the indirect method, or add up cash receipts and payments with the direct method. See whether operating cash flow is reliably covering short-term obligations. An Operating Cash Flow Ratio, calculated as operating cash flow divided by current liabilities, above 1.0 typically indicates sufficient cash to cover obligations.
Year-over-year changes reveal trends. Steady growth in operating cash indicates healthy core operations, while volatility may point to seasonal effects, billing delays, or margin pressure. Read operating cash flow into dividend or reinvestment decisions. A company that pays dividends with operating cash rather than borrowing or asset sales demonstrates stronger cash discipline.
Free Cash Flow
Free cash flow is operating cash flow minus capital expenditures. It reveals the cash remaining to drive growth, reduce debt, or distribute back to shareholders. Compute free cash flow on a regular basis to understand how much you can fund new initiatives without taking on additional leverage. A steady drop in free cash flow could be a sign of capital expenditures that are high now but will yield later, or it could mean fading operating vigor, but it depends.
Keep an eye on free cash flow trends. Invest in firms with robust positive free cash flow and explore the reasons behind negative free cash flow before ruling out an expanding firm that’s investing aggressively.
Cash Conversion Cycle
CCC tracks how fast inventory turns into cash through sales and collections minus payables duration. A shorter CCC enhances liquidity and lessens external financing dependency. Compute CCC according to the wiki and compare to industry standards to benchmark.
Decode cash flow statements. Break down CCC into parts to identify bottlenecks in receivables, payables, or inventory. Small fluctuations in these or in days sales outstanding can materially impact cash on hand, so monitor these monthly to identify liquidity problems early. Deploy tactical operational hacks such as quicker billing, leaner inventory turns, and longer payables to compress the cycle and liberate cash.
Assessing Financial Stability

Assessing financial stability means testing whether a business can meet near-term bills and sustain operations over time by reading its financial statements and ratios. Key stability metrics include debt-to-equity, current ratio, equity-to-asset, interest coverage, profit margins, and return on assets. These metrics provide a compact view of leverage, liquidity, solvency, and profitability. Below is a quick reference for two core metrics.
Metric | Formula | What It Shows |
Debt-to-Equity | Total debt / Total equity | Degree of leverage; higher values mean more creditor funding |
Current Ratio | Current assets / Current liabilities | Short-term liquidity, >1 suggests assets cover near obligations |
Debt-to-Equity Ratio
Try debt-to-equity to gauge leverage and risk. Take total interest-bearing debt that is divided by shareholder equity, including long-term borrowings and short-term portions of long debt. Compare the calculated ratio to industry standards. Capital-intensive industries frequently have elevated acceptable ratios compared to software or services.
Follow the ratio for a few periods. If it remains on the rise, it could indicate increasing dependence on debt and an increased risk profile, impacting both ability to repay and interest load. For example, a manufacturer moving from 0.6 to 1.8 over three years needs scrutiny: is growth debt-funded or covering cash shortfalls from seasonal swings?
With the ratio, make a decision about whether to take on new debt or issue equity. If interest coverage is currently poor, equity might be the prudent decision. Consider the equity-to-asset ratio: a high equity share cushions downturns and lowers default risk.
Current Ratio
For example, determine the current ratio by dividing current assets by current liabilities. A value above 1.0 indicates current assets can cover short-term claims. Context matters because very high ratios may indicate idle cash or poor asset use, while ratios near 1 require tight cash management.
Monitor your current ratio monthly or quarterly to detect cash flow issues in their early stages. Seasonal businesses need to use rolling averages or normalize for peak months to avoid snapshots that are misleading. Benchmark and peer comparisons are important; a retailer’s acceptable current ratio is different from that of a utility.
Variations in the current ratio tend to come before changes in operating profit margin and return on assets. Incorporate those metrics into your monitoring to get a more complete picture.
Interest Coverage
Calculate interest coverage as operating income (EBIT) divided by interest expense. Stay well above 1.0 to avoid default. Typical targets are 3 times or more in normal times.
Monitor trends: Falling coverage can indicate margin pressure or rising debt costs. Turn coverage into a guide for new borrowing or refinancing. Where coverage is low, favor equity or longer-term, lower-rate debt. Monitor profit margins and operating profit margin ratio because they fuel EBIT and thereby coverage. Reconsider if seasonal income variations are significant.
The Human Element In Financials
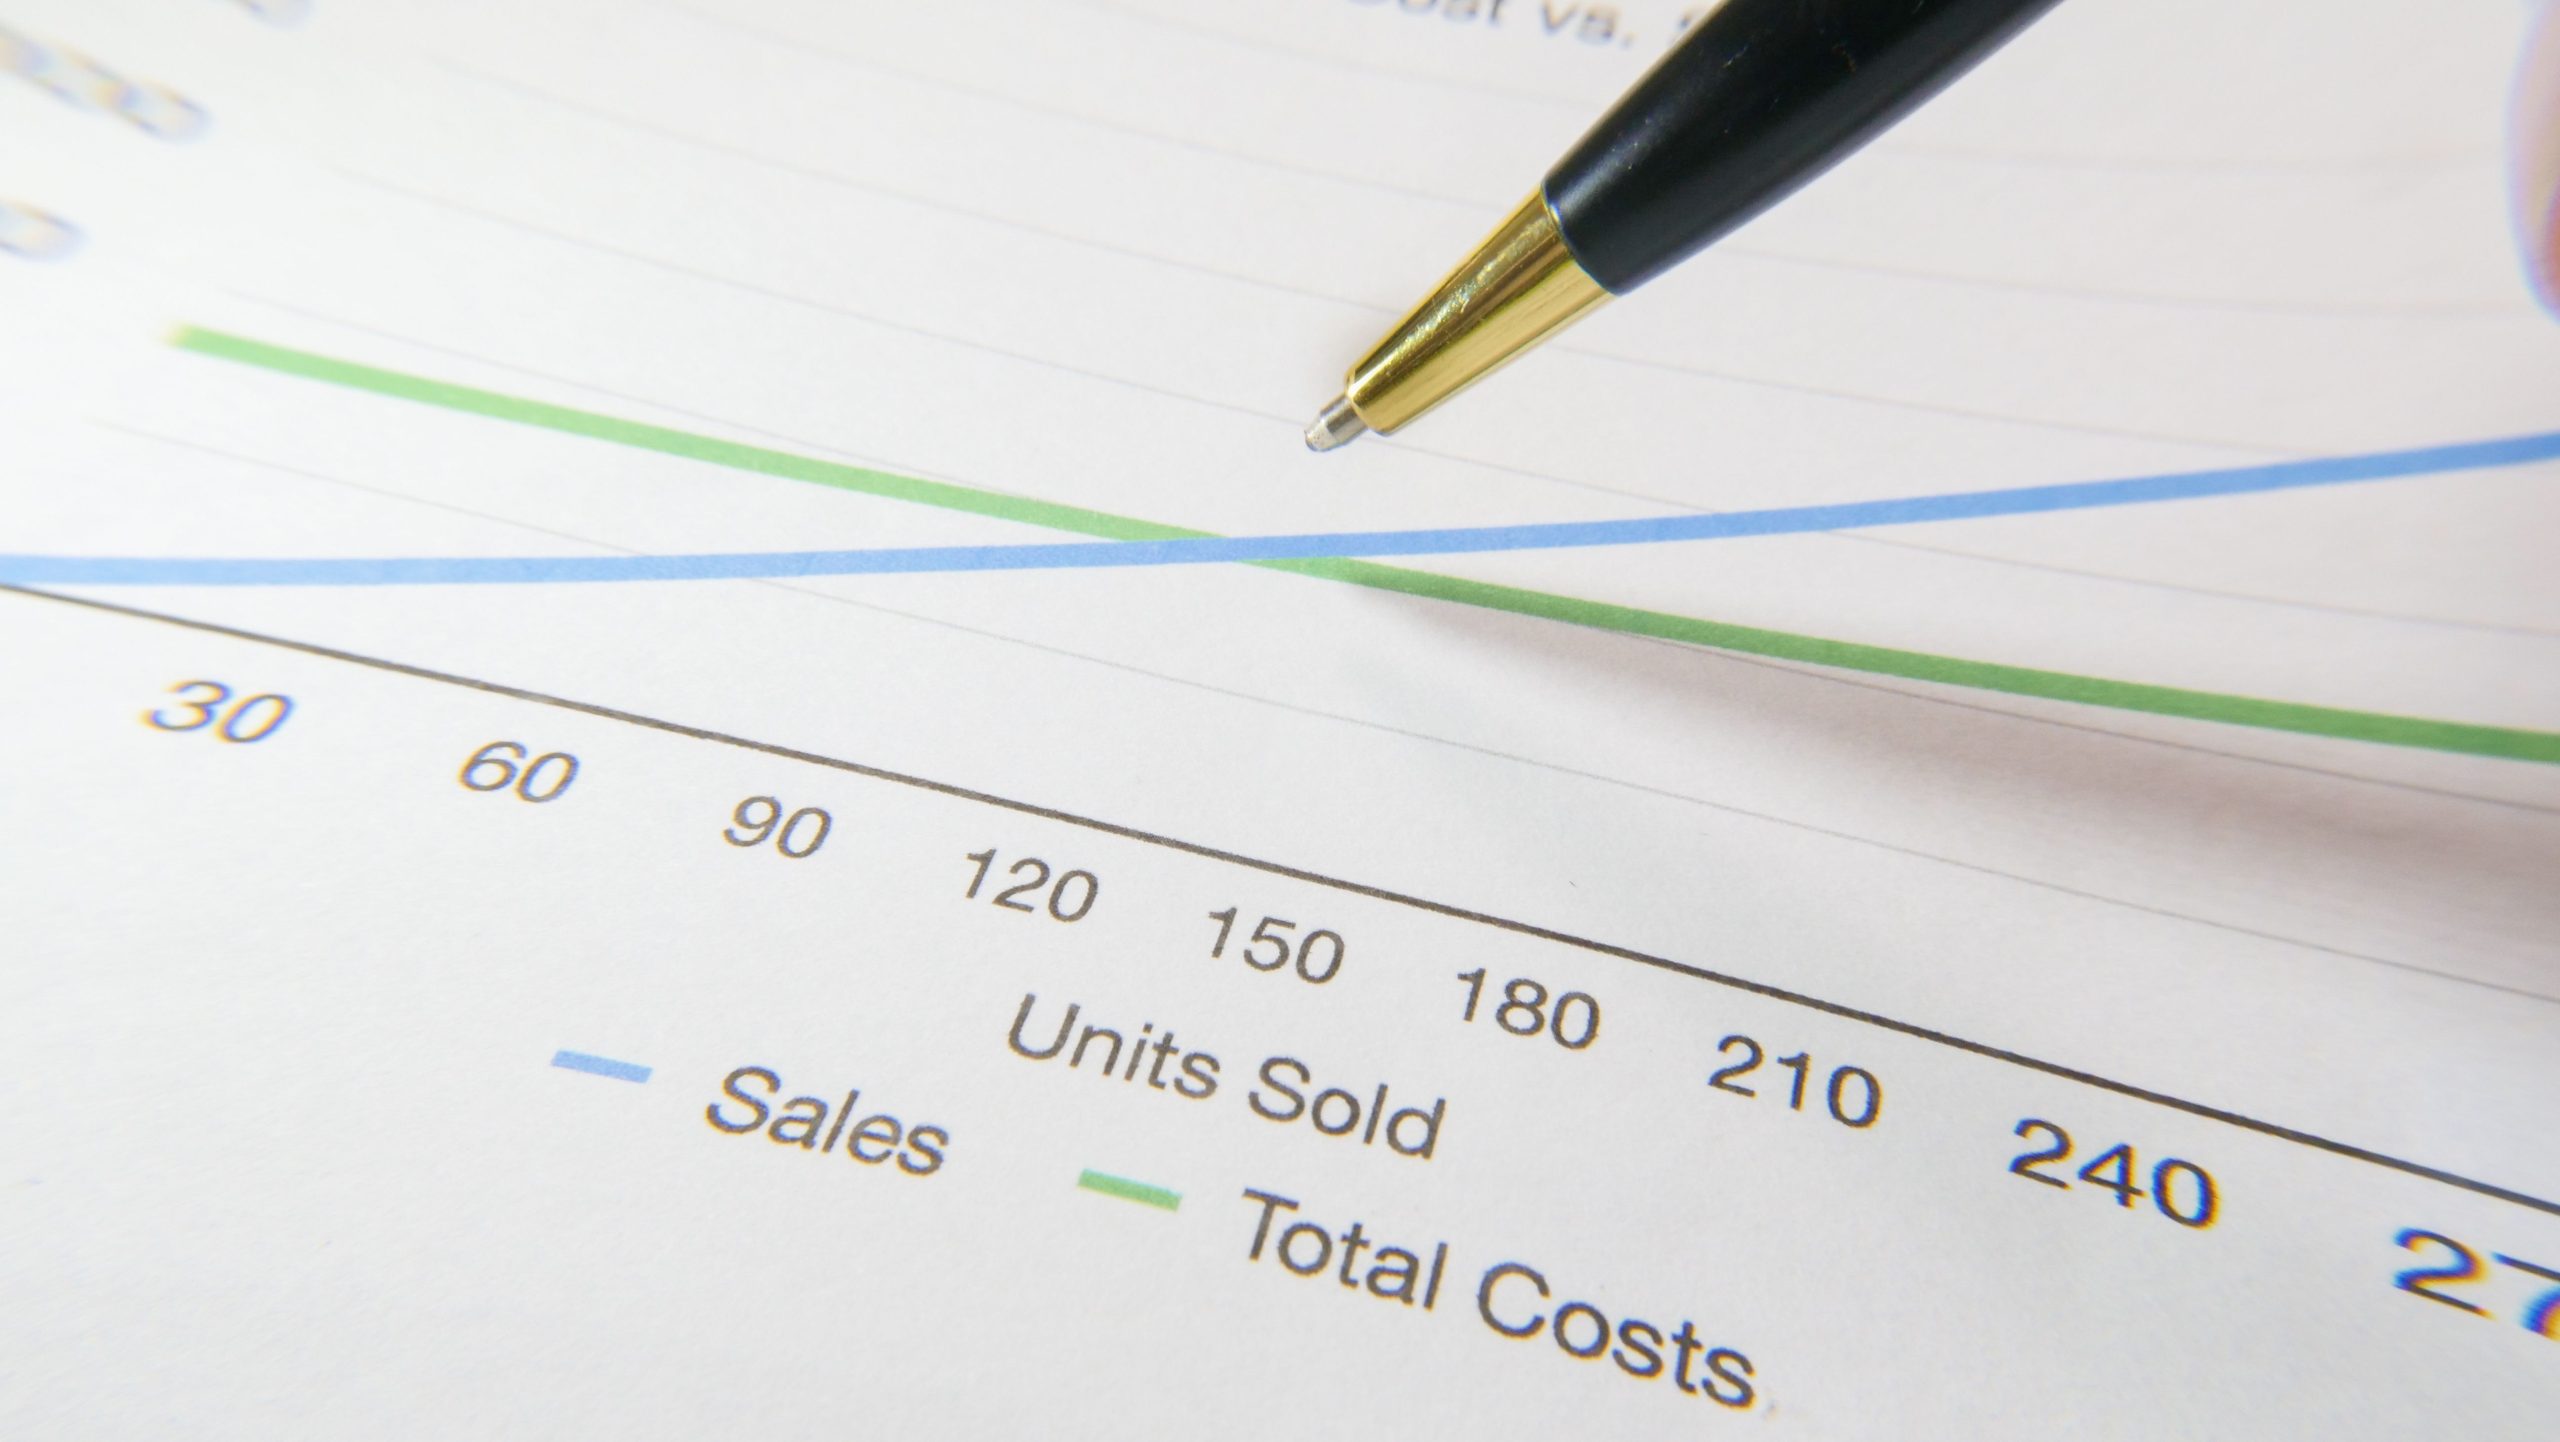
Financials are important. Humans are what push the needle. To evaluate a new opportunity, you need to read customer signals as well as ledgers. Basic instruments, such as a spreadsheet or a one-page PDF, can record key measurements, but they seldom display habits, springtime swings, or managerial decisions that alter results. Establish a simple mechanism, such as a weekly dashboard, to identify emerging patterns early and minimize intuition-driven bias.
Customer Lifetime Value
We compute LTV to predict how much revenue the average customer will generate over their lifetime. Apply a formula that multiplies average purchase amount by purchases per year, multiplied by the average customer lifespan in years. For an online subscription, LTV equals average monthly revenue multiplied by 12 and multiplied by average subscription years, minus direct costs. LTV determines how much you can afford to spend to acquire and retain customers profitably.
Compare LTV between segments to discover where to focus. An SMB segment with high churn but large one-off orders may have high first-year revenue but low LTV, which suggests different retention plays than a stable enterprise customer with a long lifespan. Track the LTV on a monthly or quarterly basis. A rising LTV indicates that you’re retaining or upselling customers more successfully, and a falling LTV indicates product or service issues, seasonality, or pricing pressure.
Acquisition Cost
Figure CAC by taking sales and marketing spend over a period and dividing that by new customers obtained in that period. Add staff time, platform fees, and creative costs for a realistic number. CAC lets you measure channel efficiency. Contrast paid search CAC with organic growth CAC to determine where to scale spend.
Monitor CAC trajectories to catch climbing costs in their infancy. If CAC jumps in seasonally slow months, it might indicate bad targeting or competitive ad inflation. Use CAC to tune channel mix. Drop channels where CAC exceeds acceptable thresholds, invest more in low-CAC channels, or shift budget to retention if acquisition becomes too costly.
The LTV: CAC Ratio
Compute LTV to CAC to assess return on acquisition. Aim for at least three to one as a rule of thumb for sustainable growth, and adjust by industry norms and margin structure. Use the ratio to split the budget between acquisition and retention. If the ratio is high, test more acquisition. If it is low, invest in retention or product improvements.
Monitor months of available liquidity alongside LTV-to-CAC to ensure cash suffices while you scale. Benchmarks and prior-year comparisons help you differentiate normal seasonality from actual decline. Human judgment must weigh in: numbers inform, and people execute.
Synthesizing Data For Decisions
Synthesizing data from multiple angles develops a more comprehensive profile of an opportunity’s financial strengths and weaknesses and connects short-term signals such as operating cash flow to longer-term drivers such as growth potential and capital structure. Synthesize data for decision-making: Use profit margin, liquidity, operating cash flow, and interest coverage ratio combined with trend analysis to transcend snap single-point judgments and bring the perspective closer to the right strategic level.
Sensitivity Analysis
- Revenue growth rate: Small shifts can swing net present value and payback time.
- Gross margin compression shows how price or input changes affect profit.
- Cost of capital: affects discount rate and valuation sensitivity.
- Working capital needs: Variations change cash flow timing and liquidity pressure.
- Capex assumptions alter free cash flow profiles and long-term returns.
- Market share changes impact scale economies and fixed-cost absorption.
What assumptions shift profit or risk the most? Typically, revenue growth, margin, and cost of capital. Conduct one-way and multi-way sweeps to identify which inputs shift NPV or IRR outside of tolerance bands. Take your analysis and build best-case (high growth, stable margins), base-case, and worst-case (demand drop, margin squeeze) views. Show results in a table of variable, tested range, impact on NPV, IRR, and notes on plausibility.
Scenario Planning
Create 3-5 coherent scenarios spanning growth, competitive, and macro risks. Model changes to revenues, input costs, and capital structure in each. Use scenario outputs to plan contingencies: hedging, staged investment, or contractual protections. Model growth rate swings, such as a range of negative two to positive eight percent per annum, cost inflation of two to ten percent, and demand shocks ranging from negative twenty percent to positive thirty percent to see cash burn, debt covenants, and funding gaps. Distill the scenarios down into a comparison table of forecast revenues, EBITDA, free cash flow, covenant headroom, and triggers for action in each case to make the decision operationally tangible.
Industry Benchmarking
Contrast margins, ROIC, liquidity ratios, and interest coverage to industry medians. Pinpoint over- or under-performance; for example, low operating cash conversion signals working capital issues to address. Use benchmarking to set targets, such as lifting gross margin by 300 basis points and reducing DSO by 10 days. Build a benchmarking table that maps company metric, industry median, delta, and recommended action. Keep an eye on year-over-year changes to identify trends and focus fixes.
Final Remarks
Straightforward figures steer intelligent wagers. Pay attention to margin, return on capital, cash flow, and leverage. Check trends over time. Match the numbers to the team, the market velocity, and the product-market fit. Use simple models to test scenarios: best-case, base-case, and stress-case. Run a cash runway readout for twelve months. Monitor burn rate and quick ratio for near-term viability. Follow gross margin and return on invested capital for value. Pair hard numbers with interviews, product demos, and other methods to identify holes. Use just one metric as a tiebreaker, not the whole story. Begin modest, study rapidly, and increase with proof.
Need a one-page checklist or a template model to apply to your next deal?
Frequently Asked Questions
1. What Are The Most Important Profitability Metrics To Check First?
Consider gross margin, operating margin, and net margin. They reflect cost control, core business health, and profitability. Trends over time matter more than a one-time number.
2. How Should I Evaluate Cash Flow Quality?
Operating cash flow and free cash flow are what we care about. A positive and growing operating cash flow indicates sustainable operations. Free cash flow reveals the ability to invest, pay down debt, and return to owners.
3. Which Ratios Indicate Financial Stability?
Look specifically at the current ratio and the quick ratio, as well as the debt-to-equity ratio. These reflect short-term liquidity and leverage. Stable or improving ratios reduce the danger of liquidity issues.
4. How Do Non-Financial Factors Affect Financial Analysis?
Think management track record, customer concentration, and employee culture. Solid teams and varied customers reduce execution and revenue risks that figures alone can overlook.
5. When Should I Prioritize Earnings Vs. Cash Flow?
Focus on cash flow when earnings are unstable or affected by accounting adjustments. Earnings are for long-term profitability trends. Use cash flow for near-term viability.
6. How Do One-Time Items Distort Financials?
One-time gains or expenses can obscure performance. Adjust for them to expose recurring profitability and cash flow. Seek core results that are consistent across periods.
7. How Should I Combine Metrics To Make A Decision?
Build a dashboard of profitability, cash flow, liquidity, and leverage indicators. Weight them by deal priorities, such as growth, stability, or cash generation, and compare trends, not just single-period snapshots.


